Solving The Issue of NSFW Games Losing 75% of Traffic On Steam
Discover how NSFW games lose up to 75% of traffic on Steam due to poor landing pages. Learn data-driven marketing tips and solutions to boost conversions, overcome traffic loss, and improve engagement for your game. Find actionable insights for better performance and success."
Did you know that as a NSFW game, you are probably losing 75% of your traffic on Steam? At Glitch, we recently worked with our first NSFW game on marketing. While these games have an edge in the kinds of content they can produce because of their seductive nature, they also face challenges when trying to promote them—the biggest one being Steam’s landing page.
In this article, we are going to cover how we discovered what Steam was costing us in traffic and how we overcame it. We are going to break down our process methodically so other game developers interested in data-driven approaches can learn a few tips on analyzing the performance of their marketing.
Analytics on Everything
At Glitch, we are a data-driven company; everything we do is decided by gathering data, creating statistics, and making data-driven decisions. With the NSFW game we were working with, we found that we had really good statistics all around. We utilized the social scheduler to gather all the results, and here is a general overview in the chart below.

While we do marketing on Reddit, YouTube, and BlueSky for the game, the primary platform is X/Twitter. The game we were working with had around 36k followers. In our first month working with them, we generated over 150,000 impressions with an average engagement rate above 3%. A typical tweet for us looked like the chart below from the social scheduler.
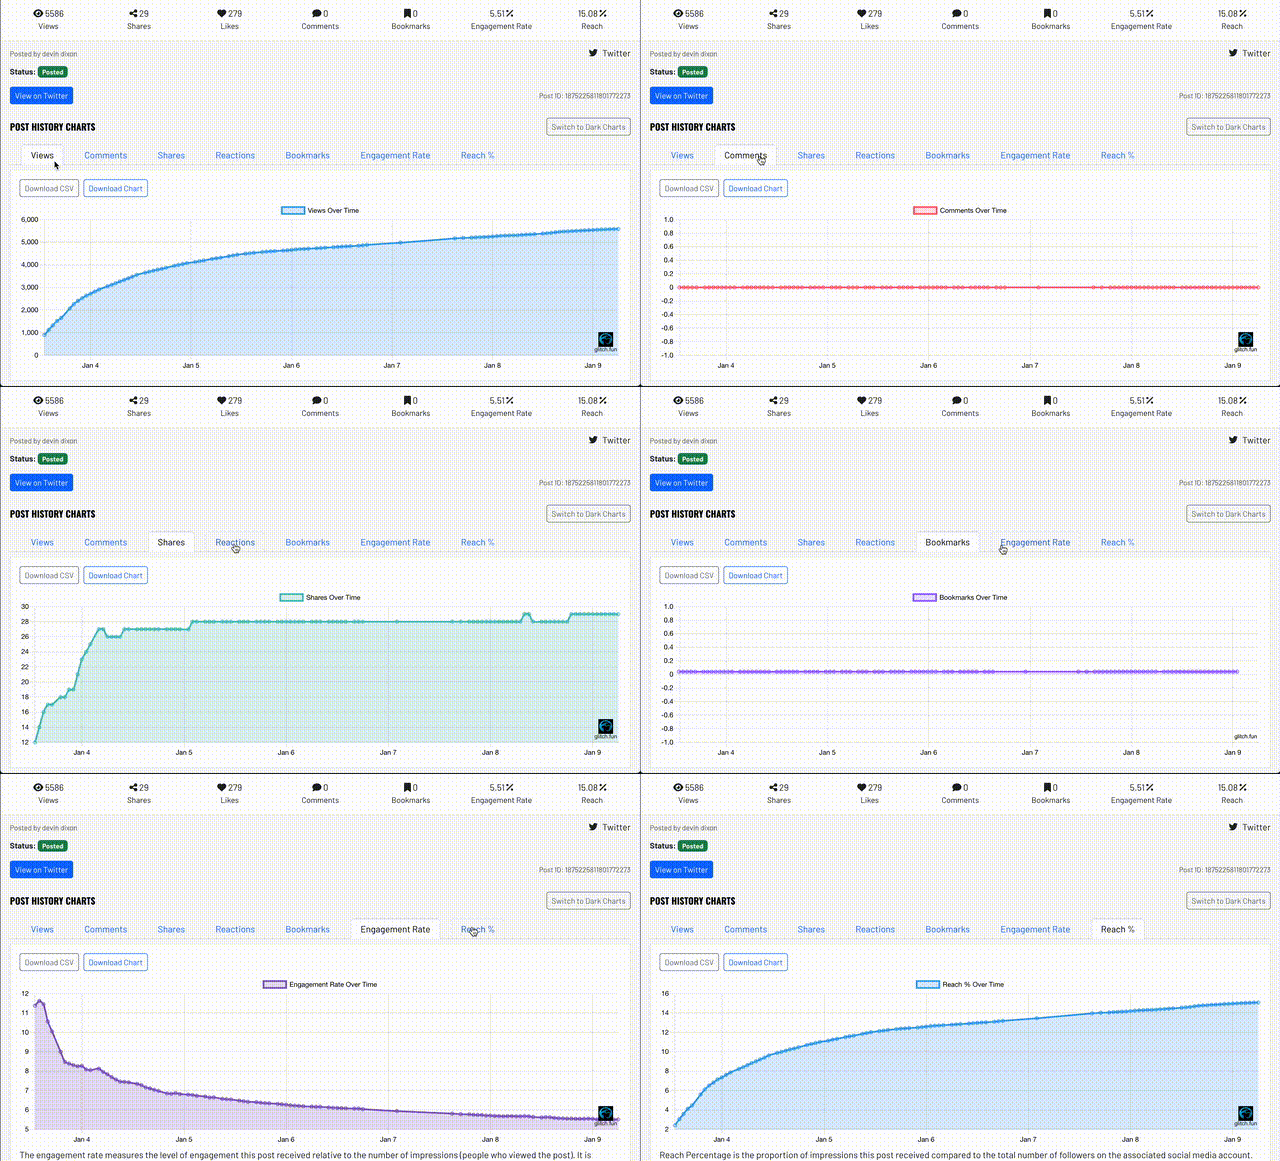
- It took 4–5 days to reach 5,000 impressions.
- Shares increased progressively over time.
- Engagement gradually dropped off after the initial peak.
- Had a 5.5% engagement rate.
- We reach 15% based on the followers
But are these numbers good? Let’s break them down.
Impressions
The first data point we are going to cover is impressions. Impressions represent awareness, meaning that people know the game exists. Game marketing is competitive, and without these impressions, prospective users are unaware of the game and cannot take any action.
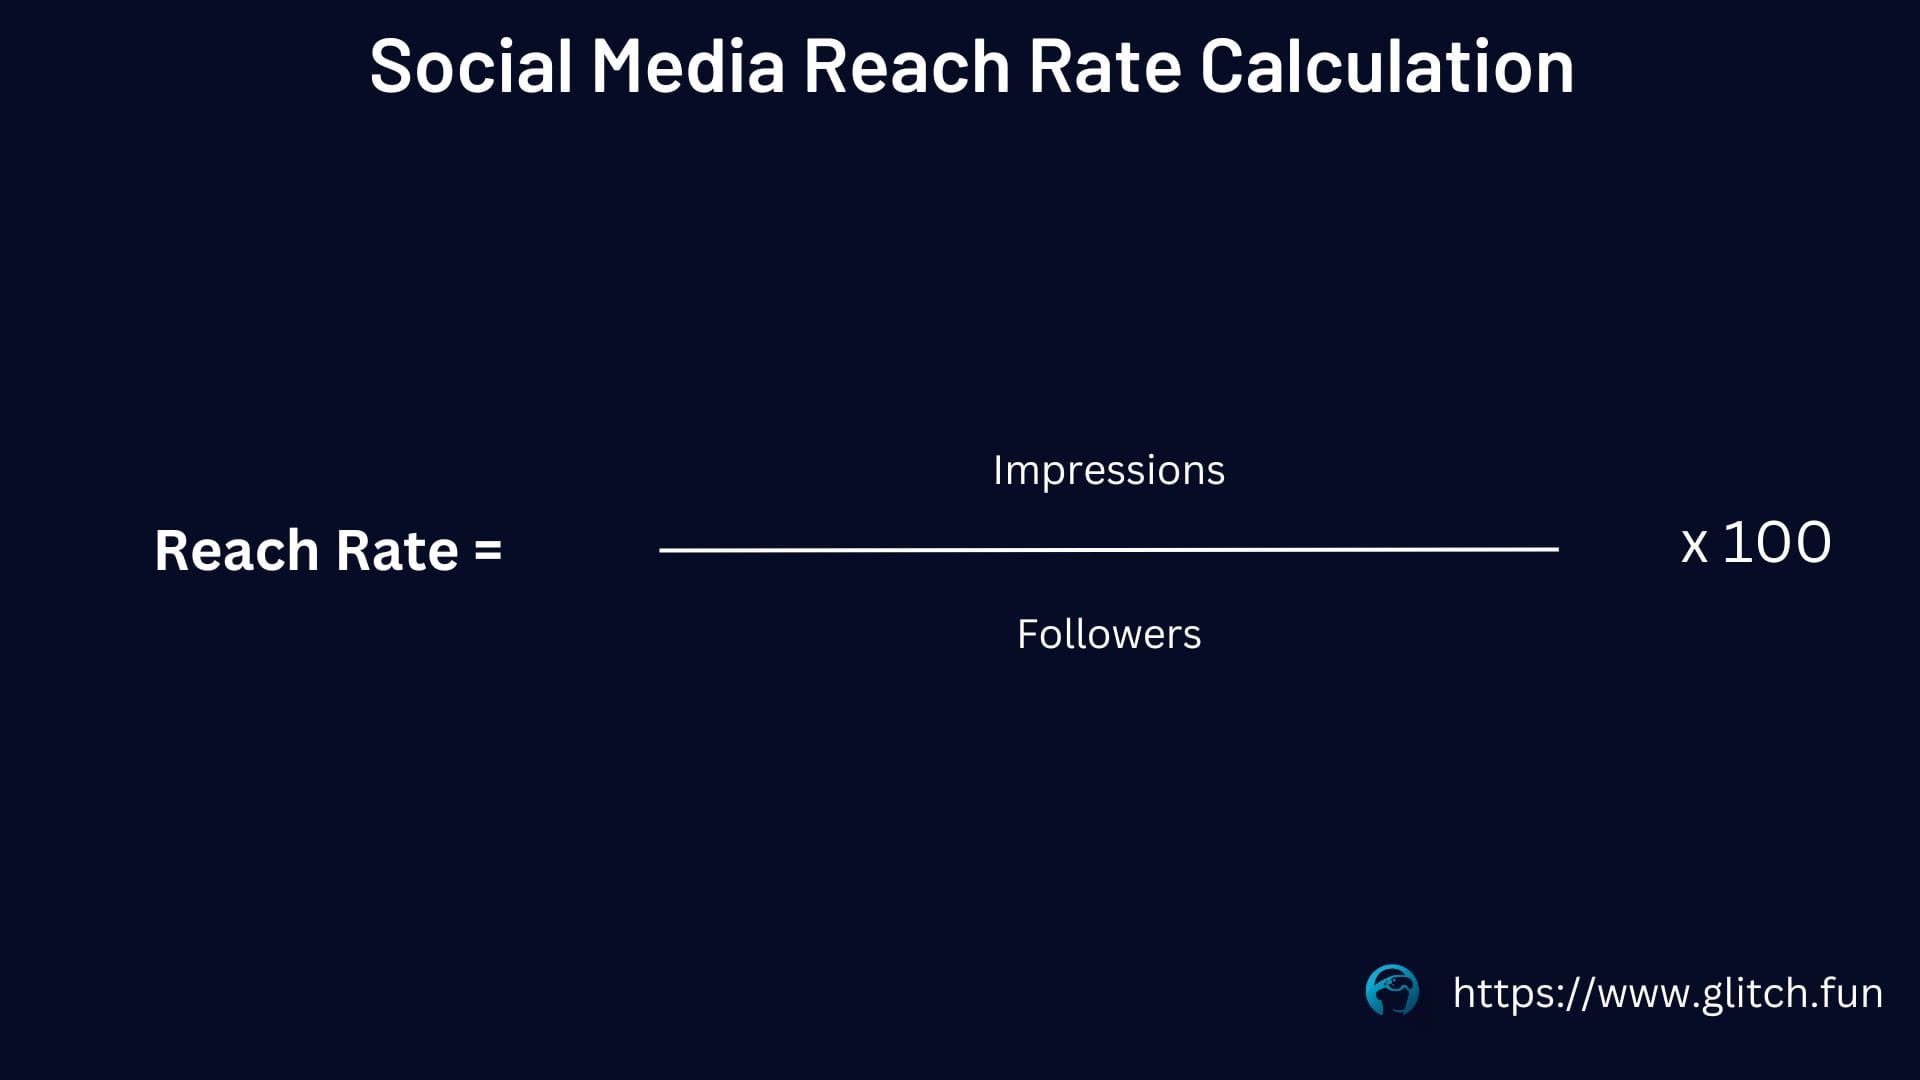
With impressions, what we want to understand is our organic reach, which is the number of people our content reaches in relation to the follower count. The formula for this is:(impressions ÷ follower count) × 100.
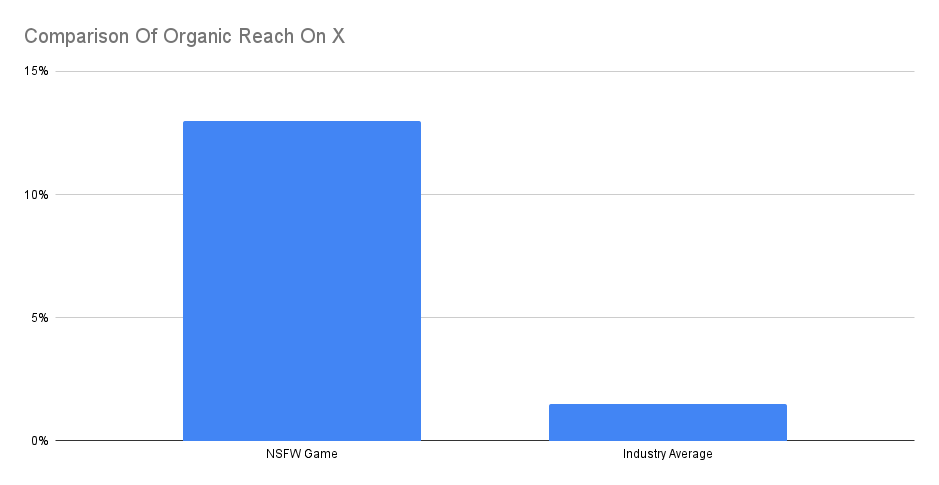
According to this Umbrex article, the average organic reach on X/Twitter is 1.5%. For the content we created for the NSFW game, a single post garnered around 5,000 impressions on average. If the follower count was around 36k, the organic reach for our post is 13%. This is more than ten times the average, so our reach is not a problem.
Now we need to check if the quality of the content is good and resonates with the audience. That’s what we use engagement for.
Engagement
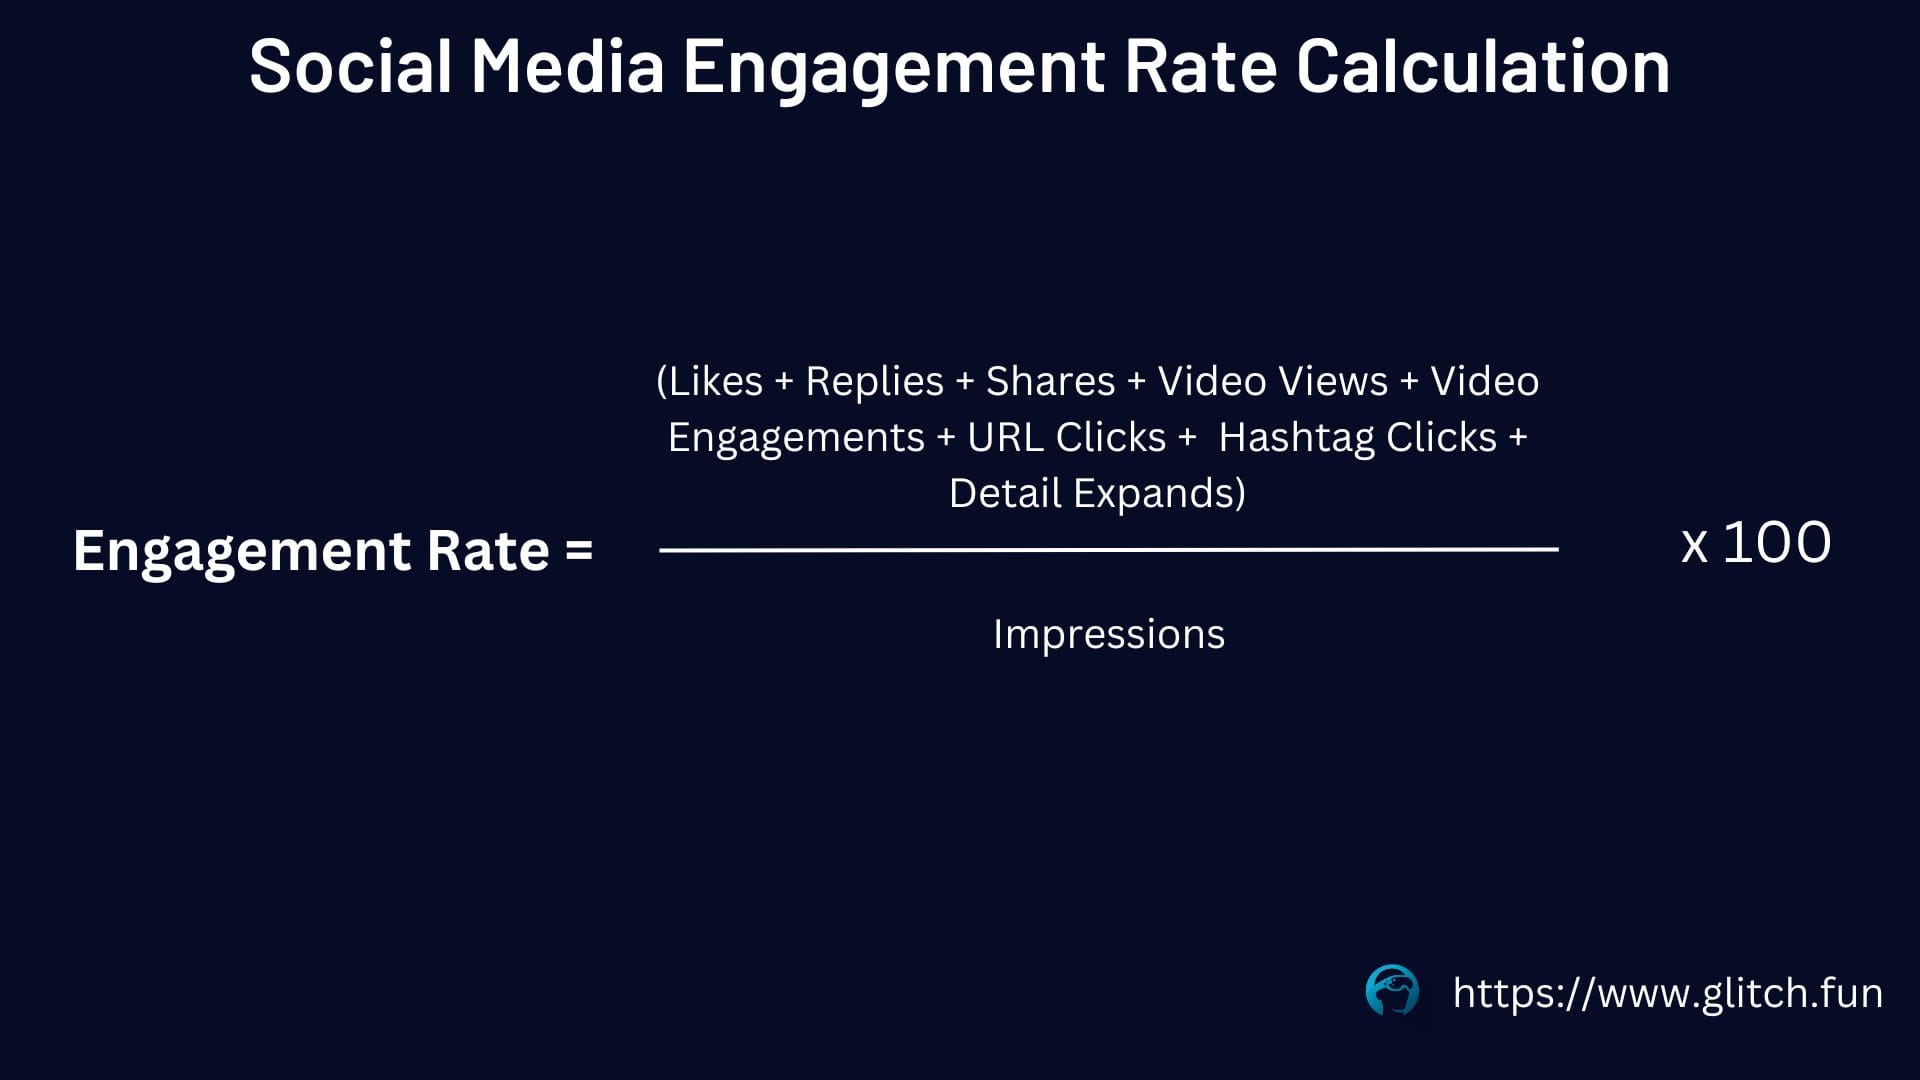
Hearts, likes, shares, upvotes, and comments—all of these count as engagement with content. Engagement shows that people like the content. To calculate engagement, we use the simple formula:(engagement ÷ impressions) × 100.
But is this engagement good? Let’s set a baseline using these Hootsuite statistics.
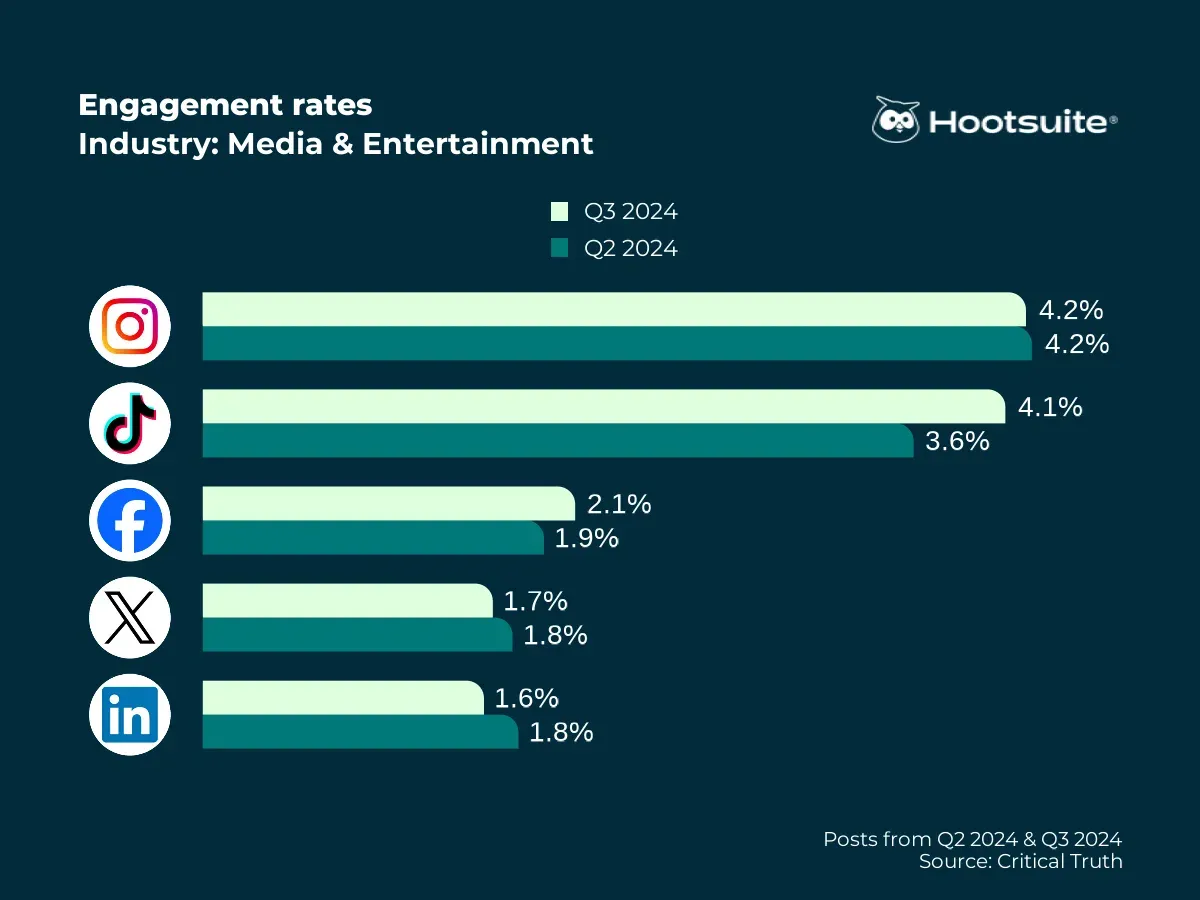
The chart below by Hootsuite says that on Twitter/X, 1.7% is the average engagement rate. Plugging in our data from our social scheduler on X, our 3% engagement rate is almost double the average.
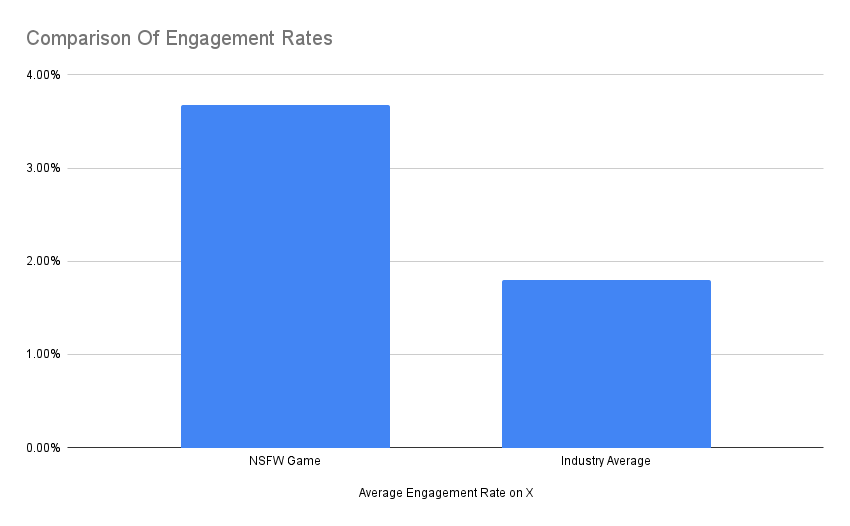
So we have great reach and great engagement, meaning we are creating content that people like. Now let’s check the conversions on Steam to see how much traffic all this engagement is driving; otherwise, it’s just vanity.
Conversion to Wishlist
To set a baseline, we have a chart to help us understand where we rank (see below).
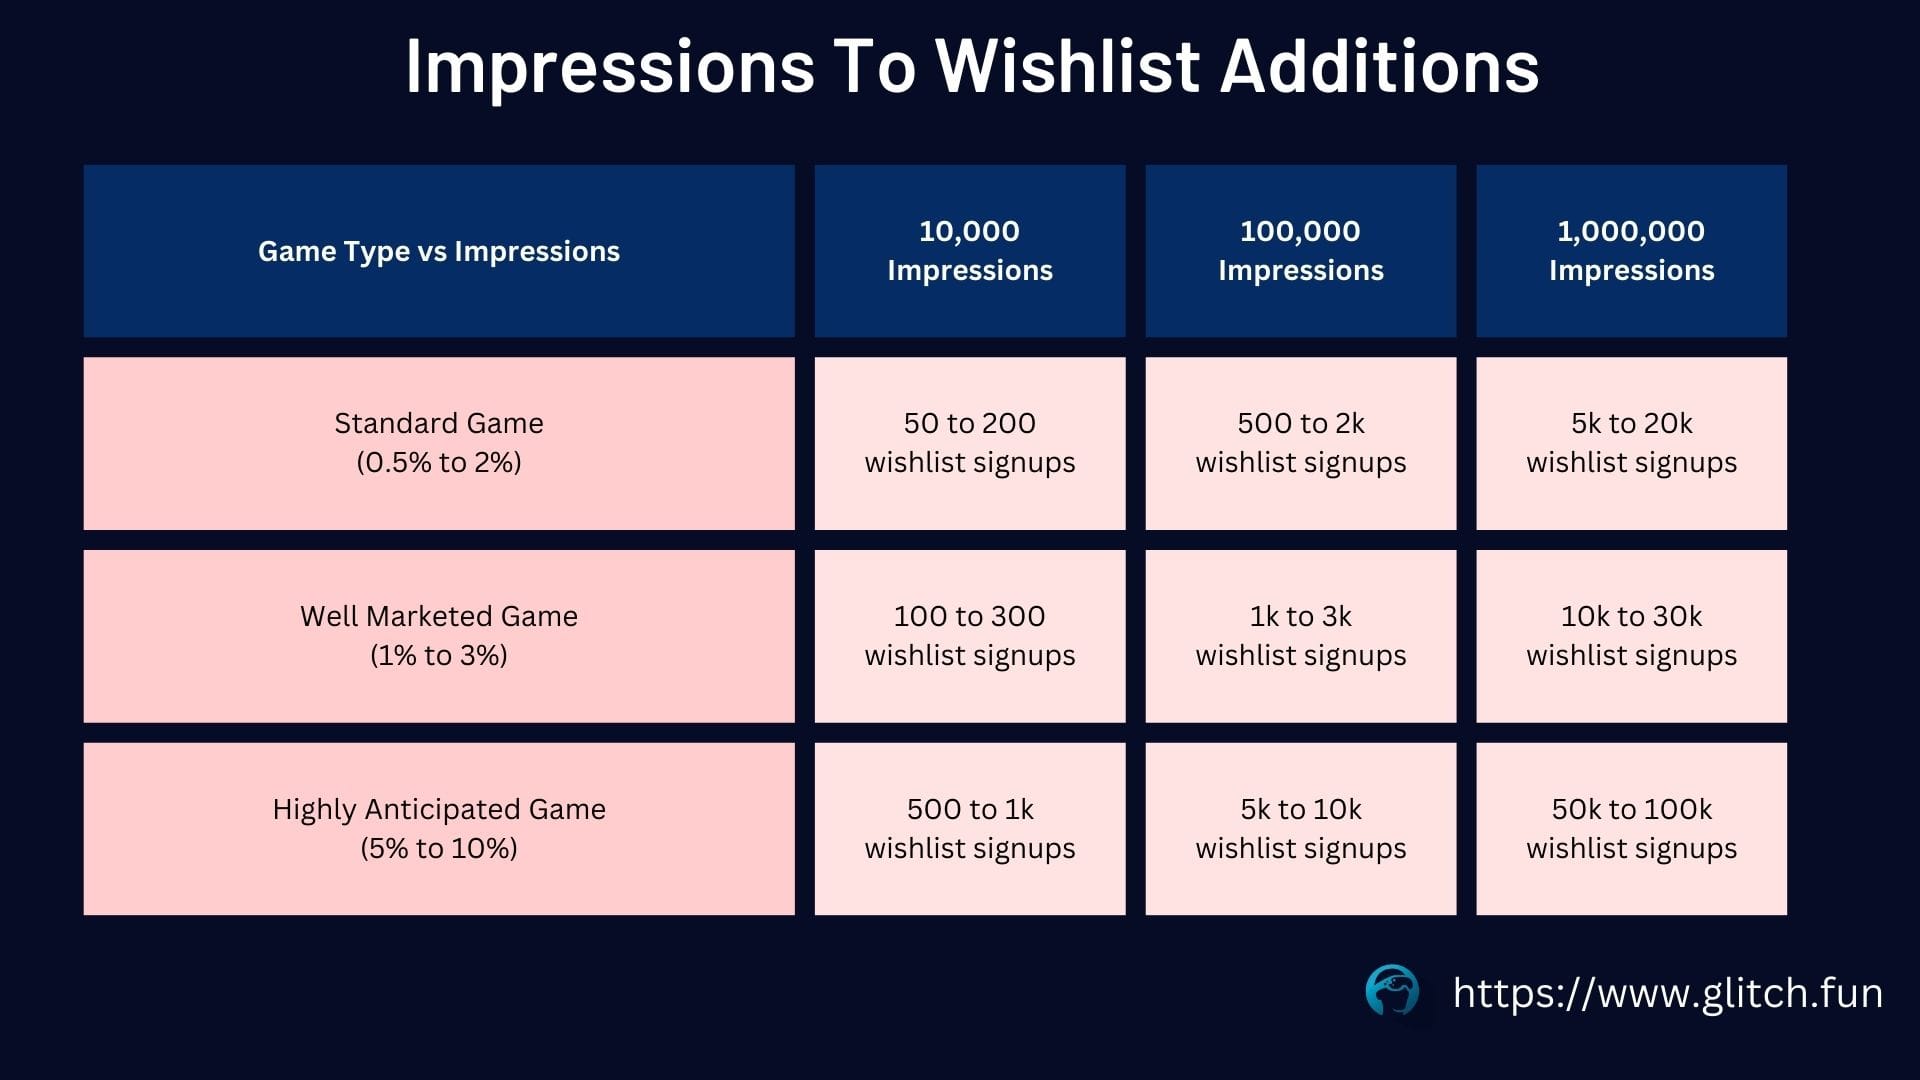
Based on our social reach and engagement, we are a well marketed game. According to the chart, if we generate 150,000 impressions in a month and have the a conversion rate of 1% to 3%, we should have 1,500 to 4,500 wishlists. This translates to 48 to 145 wishlist additions per day. And this is where we got the first surprise, as shown in the chart below.
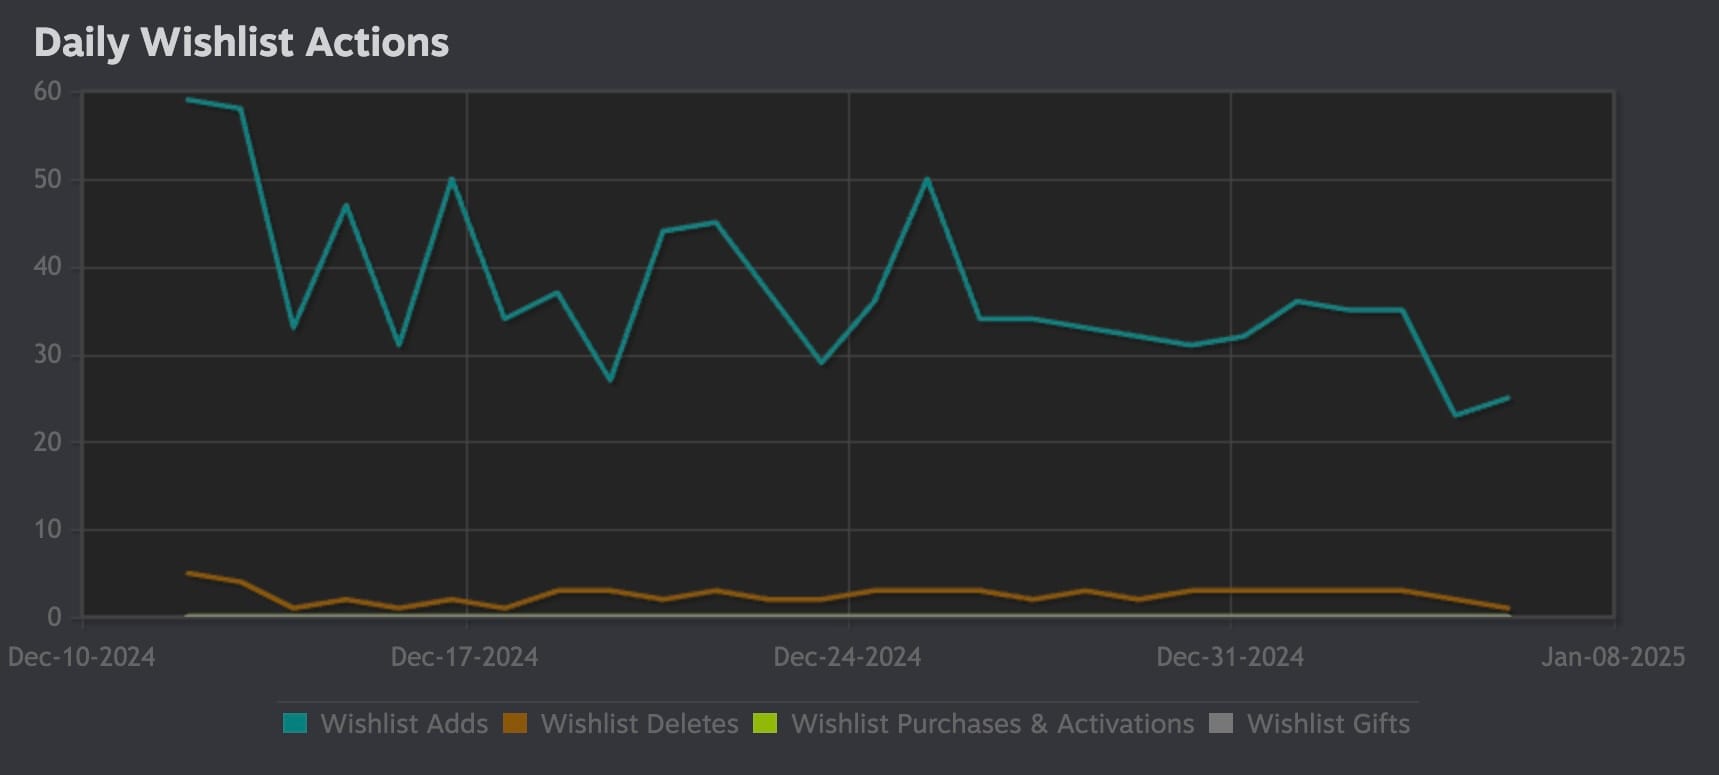
We were getting about 31 wishlists a day, placing us at the bottom of the tier of a Standard Game. This was shocking given how strong our social media metrics were. Did people just like the content with no intention of buying the game? Something felt very off, like an important piece of the story was missing. So we had to dive deeper.
Steam’s Marketing Results
We pulled up Steam's results to check the impressions. The first thing to do was look at the conversion rate. On Steam, the conversion rate can be calculated as:(wishlists ÷ unique visits) × 100.
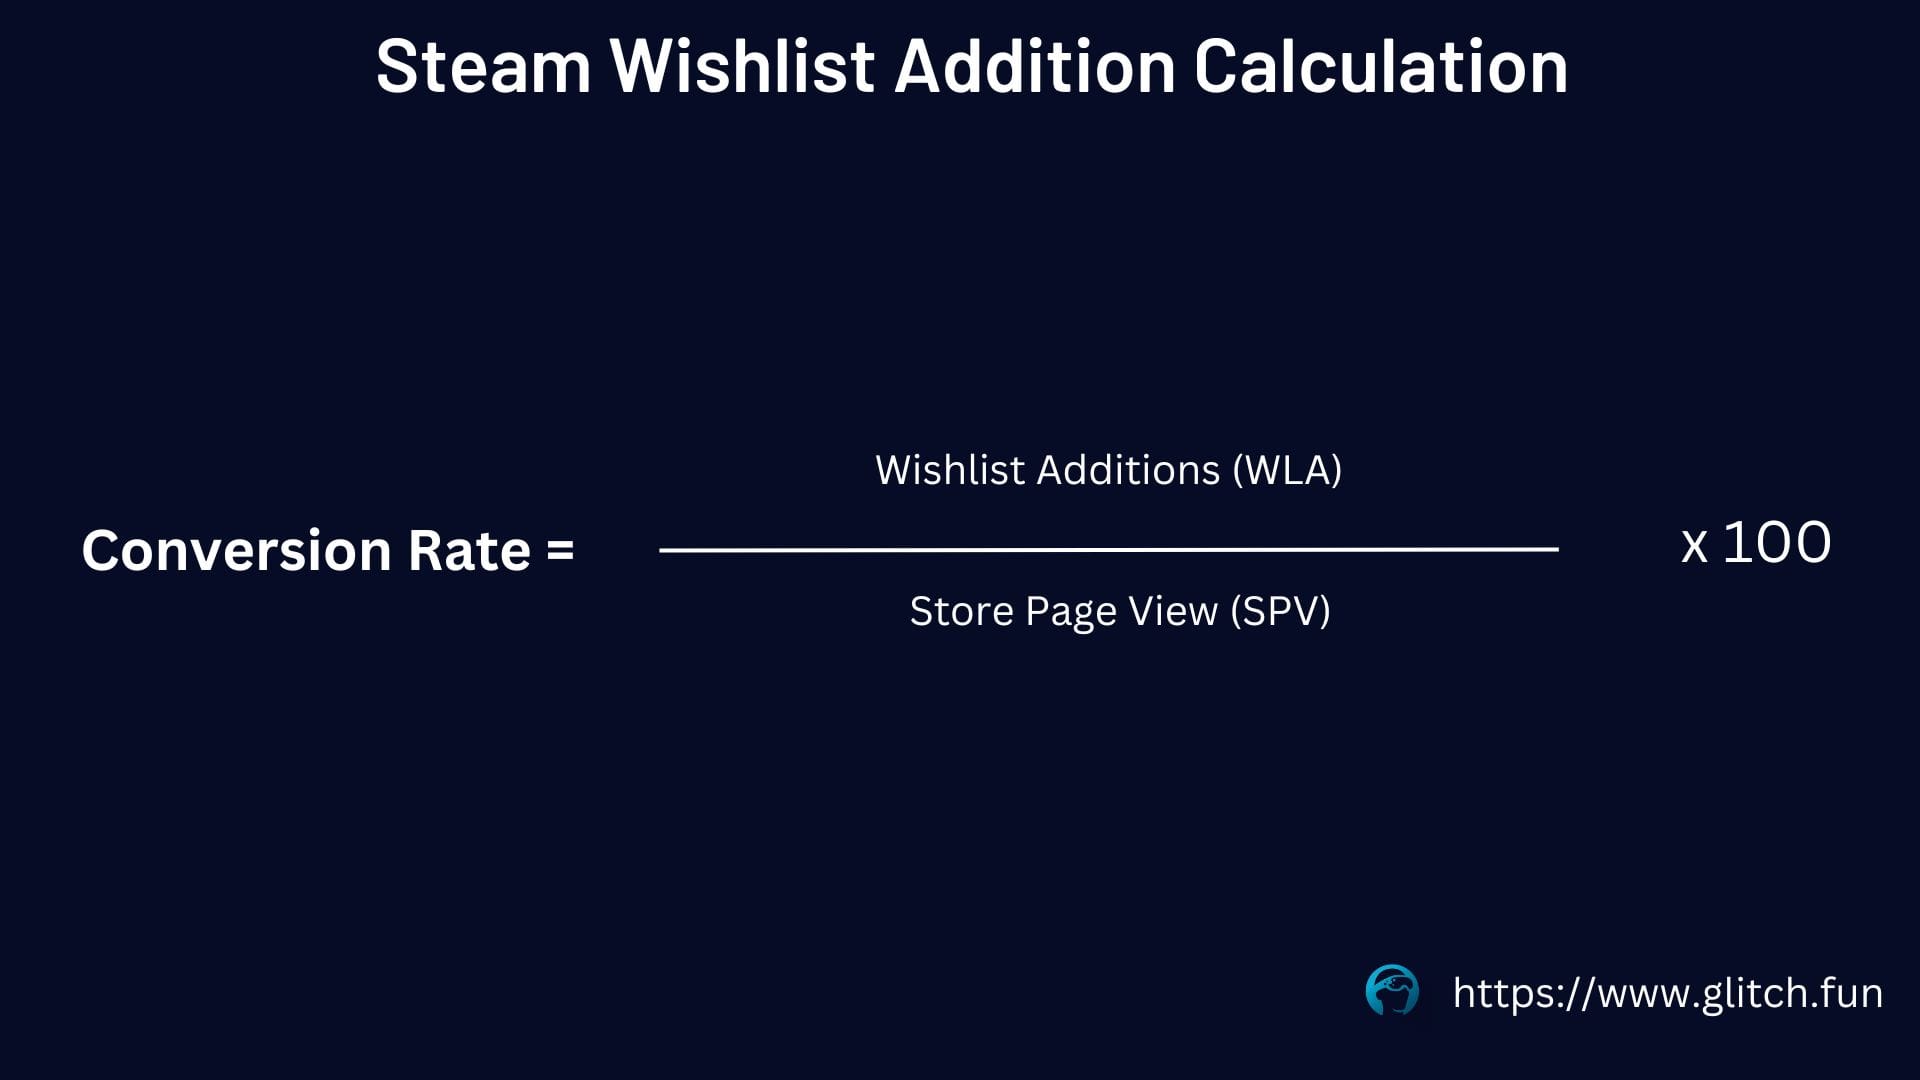
We saw we had 5,466 visits and 1,128 wishlist additions. The game is converting at 20%, or 1 out of every 5 people! That’s really good! So that’s not the issue. But 5,466 visits seem very low.
When we filtered down to just external website traffic, a surprising stat appeared: only 2,180 visits. From 150,000 impressions to 2,180 unique visitors is just 1.45%—a significant drop. Downloading the charts from Steam revealed this:
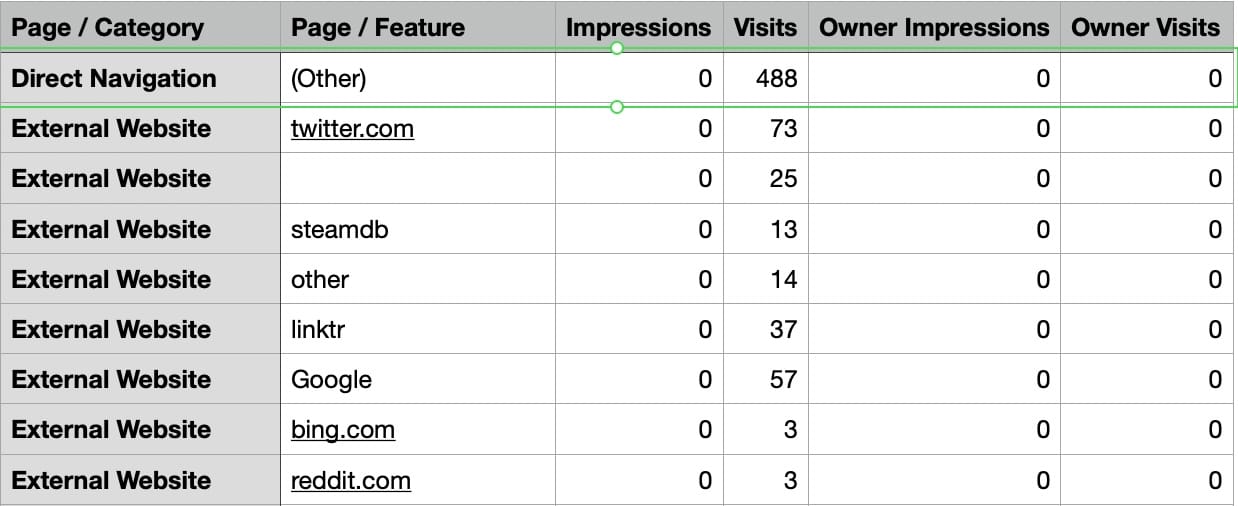
We only had 73 X/Twitter views! This definitely couldn’t be right. X/Twitter doesn’t provide link click statistics for organic content, but we do have a LinkTree that does.
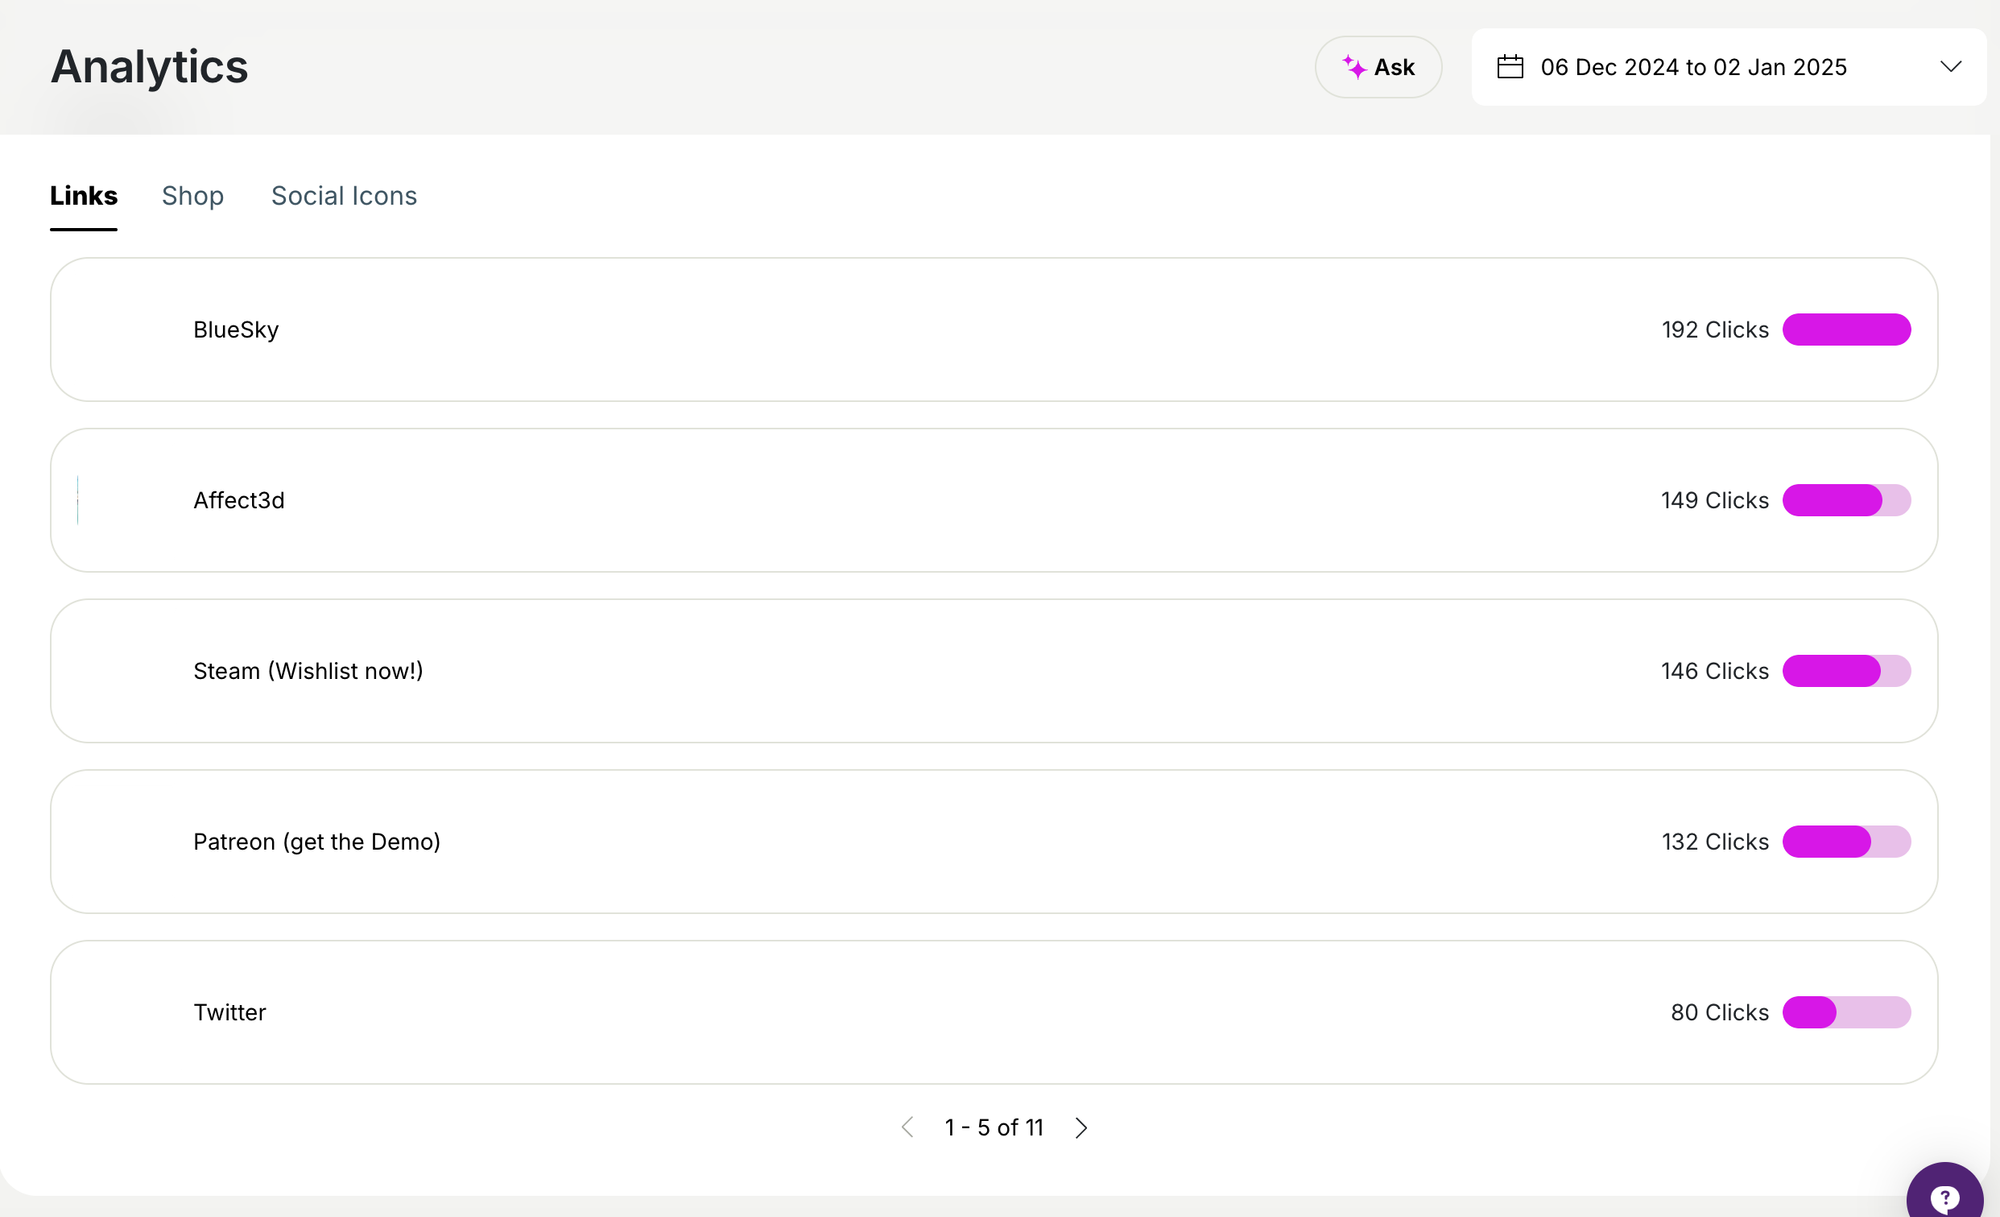
Opening up LinkTree, we found 148 clicks to the Steam page, yet only 37 were showing up on Steam. In other words, 75% of traffic was lost. That's a lot of potential wishlist additions being lost. But why?
The Culprit: The Landing Page
Losing 75% of traffic is not something to take lightly. If we have a 20% conversion rate and 148 clicks came from LinkTree, that means around 33 wishlists were lost during this period just on LinkTree. Over time and with larger amounts of traffic from all the platforms, this adds up to a significant amount of Wishlist additions being lost.
Then, on X/Twitter, an alarming tweet said it all:

The user was getting an “Oops, sorry” page and thought it was a mistake. How many other users were thinking the same thing? Further investigation revealed that all NSFW games have this same type of landing page.

Normal Steam landing pages guide users on where to go and what to do, with interactive next steps. NSFW landing pages simply display an “Oops, sorry” message that looks like an error page. Beneath that, it tells the user to log in, but the text is tiny and unnoticeable. There are no buttons or links directing users to the next step. This page provides a terrible user experience, which explains the significant traffic loss.
So, we started telling users in our content, “If you see an ‘Oops, sorry’ message, you must log in to Steam to view our game’s page.” The results were immediate:
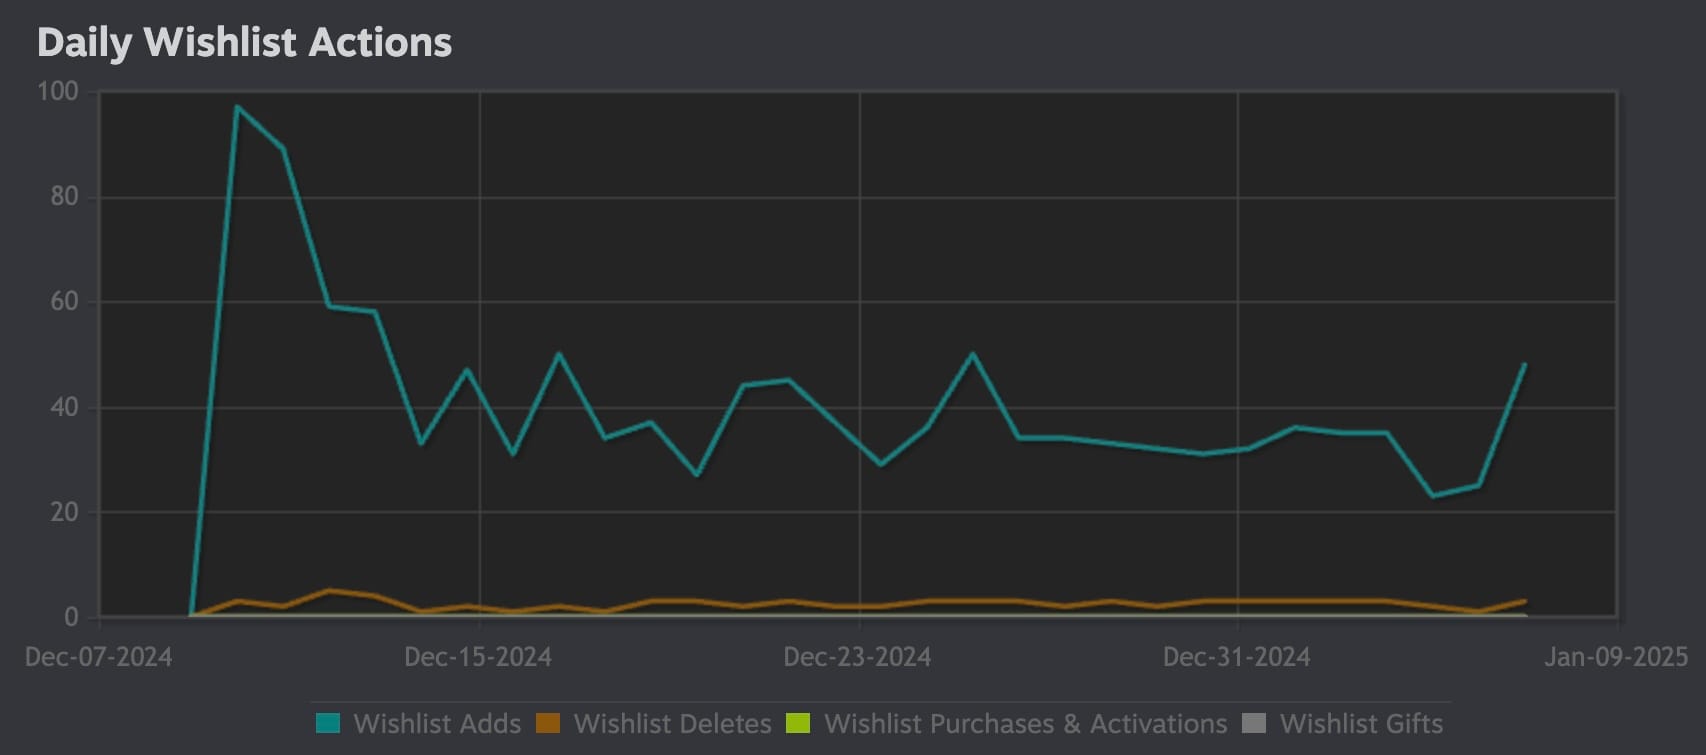
The wishlists almost doubled. We were indeed losing users due to the poorly implemented landing page.
What This Means for Other NSFW Games and Steam
When viewing other NSFW games’ Steam landing pages while logged out or in incognito mode, they all display the “Oops, sorry” page. This means they are likely losing traffic—and revenue—too.
This lost revenue isn’t just isolated to the games but also affects Steam itself. With Steam taking 30% of each sale, their platform suffers as well. We tried reaching out to Steam’s support, but we were unable to make progress. It’s possible the support team isn’t empowered to address the issue or consider it in terms of Steam’s bottom line.
Potential solutions to the problem include:
- Collectively contacting Valve (Steam’s parent company): Valve has a page of people to contact here: Valve Software. If enough games raise the issue with individuals like John McDonald, Kristan Miller, or Tom Giardino and frame it as a missed revenue opportunity, Valve might address the issue.
- Avoiding Steam altogether: Many NSFW games already release their content on platforms like Patreon and Itch. If conversion rates are strong there, developers might consider sticking with these platforms.
- Informing users about the “Oops, sorry” page: While not the most glamorous solution (pun intended), educating users about the issue can make a difference.
We personally favor option one because it offers improved long-term success for all NSFW games. However, developers should approach raising the issue collectively.
Overall, we hope this article sheds light on how to break down analytics to solve marketing problems. We also hope it sparks action to improve marketing and overall conversions for all NSFW games.


