How to Analyze Your NextFest Wishlist Data for Better Game Launch Results
Discover why high wishlist numbers from Steam NextFest don’t always translate into strong game sales. Learn how to analyze wishlist quality, track engagement, and improve conversion rates with data-driven insights.
NextFest is one of the premier events for indie developers to showcase their work. It’s where many games gain their wishlists and can springboard into success. To those who saw a spike in their wishlists, congratulations! It’s well deserved.
While all these feelings of excitement and accomplishment are great, there still needs to be a strategy for launch. Part of that strategy—and its outcome—can be informed by the reception at NextFest.
The problem is that some games, even those that get thousands of wishlists during NextFest, end up with almost no conversions from those wishlists into purchases at launch. What gives?
At Glitch we data-driven marketing automation for games, and we are going to apply some of those data-driven approaches to this article. This is a hypothetical article because, at this stage and with the available data, there are not enough data points at scale to draw a definitive conclusion. Therefore, we will use inferences based on heuristics or abductive reasoning, which is a logical process that uses observations to form a hypothesis that best explains why high wishlists do not always convert into sales for some games at NextFest.
Understanding the User Who Wishlists at NextFest
First, we have to put ourselves in the position of the user who wishlists. For users, NextFest is like an all-you-can-eat buffet where you aren’t charged for taking a full plate of food you never eat. You can grab 10 plates of food, eat nothing, and walk out without consequence.
For developers who have attended large conferences like GDC or DICE, you know how you might go around picking up tons of free swag (candy, shirts, hats, etc.) with no intention of further engaging with the person or company handing out the swag.
NextFest is kind of the same thing. The biggest mistake is believing that just because you’ve gotten a large number of wishlists, your game is doing well. NextFest is known for producing some of the weakest wishlist additions in terms of eventual conversions to sales. However, a blanket statement of "NextFest Wishlist Are Bad" is wrong, and requires a deeper understanding of the user's behaviour.
In sales, there is a concept called lead scoring, where you assign points to a person based on their actions, and the more points they have, the more likely they are to convert into a customer. For example:
- Checked out Steam page = 1 point
- Wishlisted your game = 2 points
- Played the demo = 5 points
- Played the demo and wishlisted = 10 points
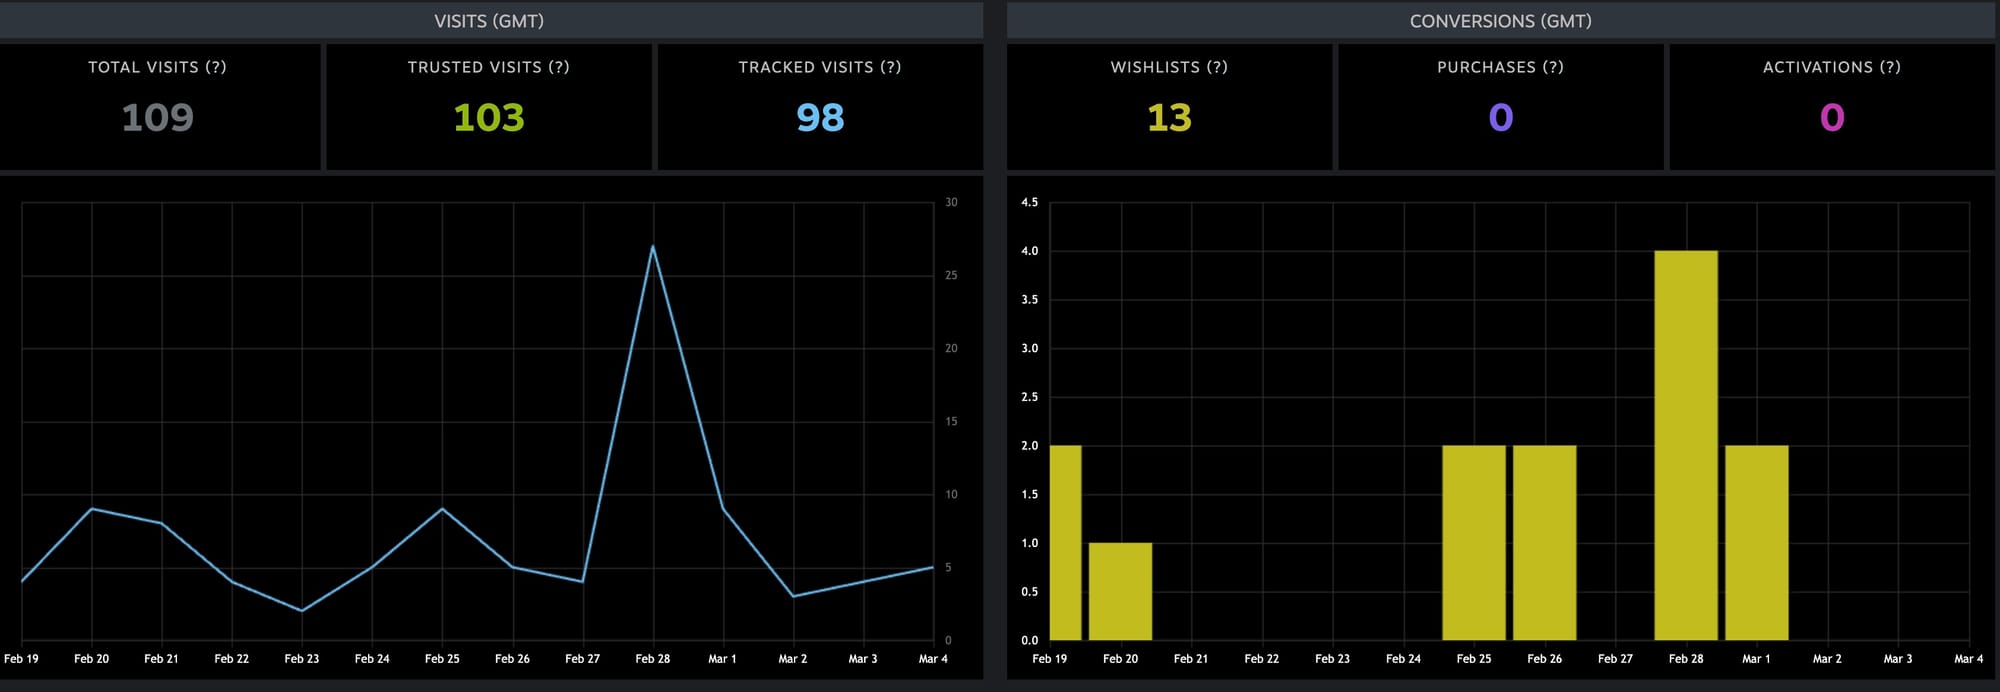
We are going to do something similar with NextFest wishlists based on people’s actions. The most important piece of information Steam gives you at the end of NextFest is a small chart that breaks down your game’s performance along these lines:

- Total Players: Shows the overall reach of a game's demo during NextFest, indicating how many people engaged with the playable version.
- Total Wishlists: Reflects the total interest generated by a game, as players add it to their Steam wishlist after trying the demo.
- Played and Wishlisted: Highlights the most engaged users who actively played the demo and then expressed interest by adding the game to their wishlist.
We are going to create three buckets that indicate the likelihood of a wishlist converting to a sale:
- Low Quality Wishlist: These are people who are least likely to convert based on their actions—let’s estimate around 5%.
- Medium Quality Wishlist: These people show a certain level of interest; we’ll give them a 20% chance of buying your game.
- High Quality Wishlist: These are highly engaged people who love your game; we’ll assign them a 40% chance of converting.
Total Wishlists & Low Quality
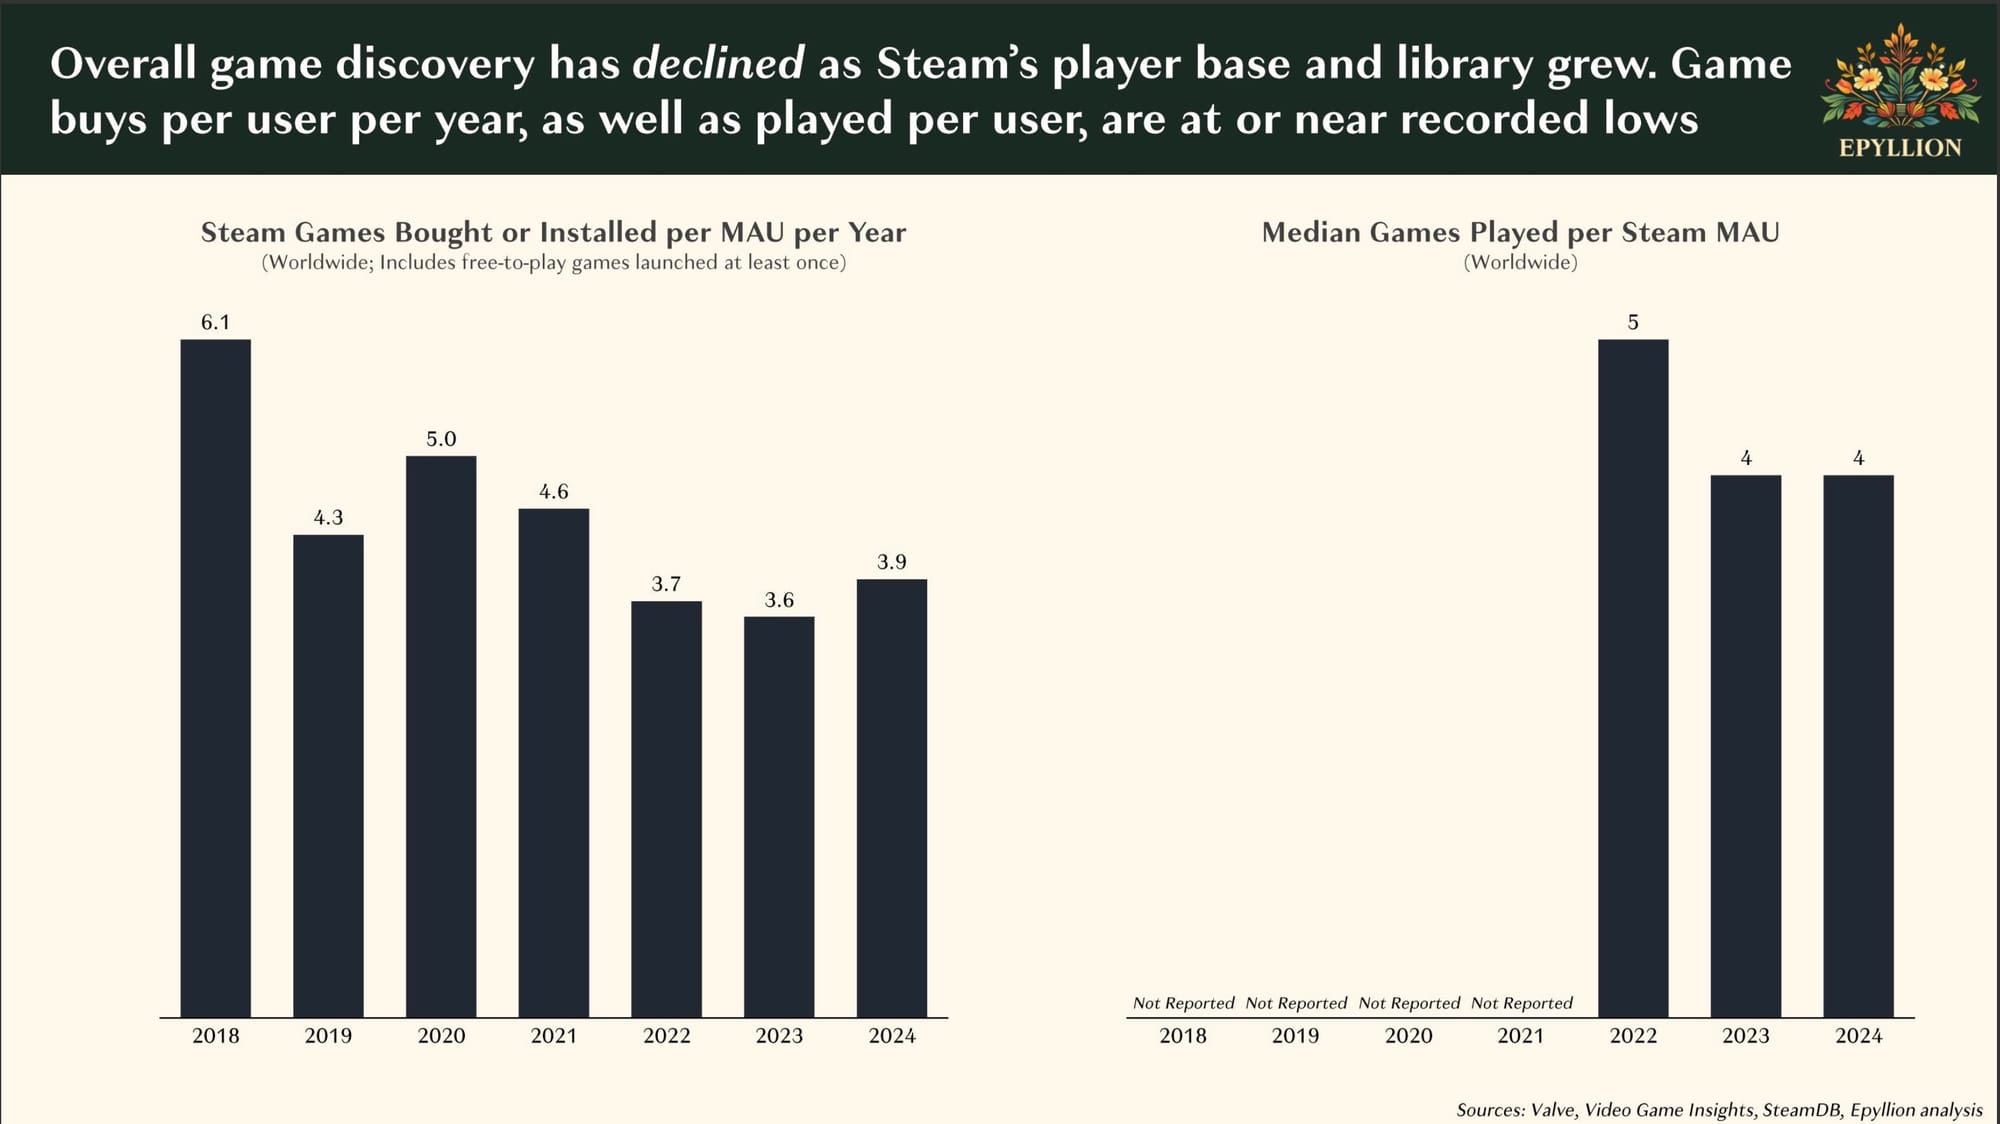
According to Mathew Ball (Gaming VC), the average person plays four games a year. There is no released data on the average number of games a person wishlists during NextFest, but wishlisting is a fairly easy, noncommittal action.
So the people who only wishlist your game without ever playing it are the ones who just want “free food.” They haven’t really engaged with your game before or after that click, so they will likely have little to no recall of your game. To determine the number of low-quality wishlists, let’s use this simple formula:
Low Quality Bucket = Total Wishlists - Played & Wishlisted
There should be an exception to this rule: if the wishlist without playing the demo is not that user’s first touchpoint with your game. In marketing, a touchpoint is any interaction or point of contact between a brand and a potential or existing customer throughout their journey. These interactions shape customer perceptions, influence decision-making, and contribute to brand awareness.
For instance, you might be promoting your game on social media during NextFest to drive awareness and gather more wishlists. A person first sees what you posted and becomes interested, then decides to research more. At that point, they might not have time to play the demo, so they just wishlist it. Because this is not their first interaction with your game and is part of a research process, this wishlist should be ranked higher in quality.
You can identify external sources by using Steam’s UTM tracking. Hopefully, any marketing you have done outside of Steam is being tracked with UTMs, so you can trace the source. At Glitch, this is one of the things we do with our social media marketing automation tools. Likewise, if you ran ads for NextFest, you would also have UTMs attached to those ads.
Let’s revise our formula a bit:
Low Quality Wishlist = Total Wishlists - External Source Visits To Wishlists - Played & Wishlisted
Medium Quality Wishlist = External Source Visits To Wishlists - Played & Wishlisted
The only problem with this formula is that Steam does not tie those who come from an external source to whether they played the demo or not, so the number won’t be fully accurate. However, it does give you a way to further segment your list.
Analyzing the Play Demo Time
The next stat to look at is playtime in your demo. It’s important because it shows that someone truly likes your game; remember, you are competing to be one of the four games that person will actually play in a year. (With the exception of idle games that do not require a user to be present, low vs. high playtime can correlate with wishlist quality and the likelihood of conversion.)
An example of a bad average play chart might look like this:
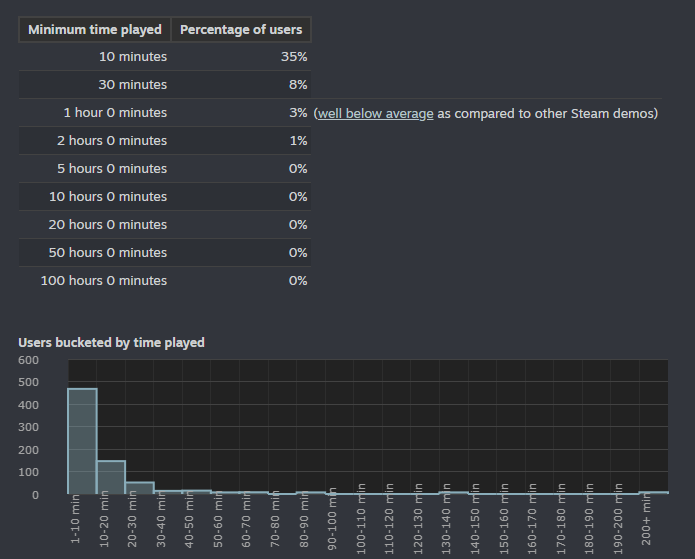
The majority of people only play for 10 minutes, which means most people were not impressed by the game and likely will not buy it. If your game’s stats look like this, it’s an indicator that you need to improve the early aspects of your game—like onboarding.
To assess, you should:
- Have Tracking and Funnel Enabled: In your game, have tracking software like Mikros Analytics enabled. Use funnel tracking to see how users progress through areas of your game and identify where they drop off.
- Play Testing: Utilize playtesting with recorded gameplay to pinpoint where issues might be occurring in your game.
- Feedback Through Communities: If you have started some sort of community, try to solicit feedback from your community members.
- Feedback Form in the Game: Provide a feedback option in areas like your title screen.
Addressing short play sessions is mission-critical to your game. If about 30% of players are not reaching even an hour of playtime, you should research more about what’s happening during those early moments. On the other hand, if your playtime histogram and breakdown look like the example below, your game is in good shape:
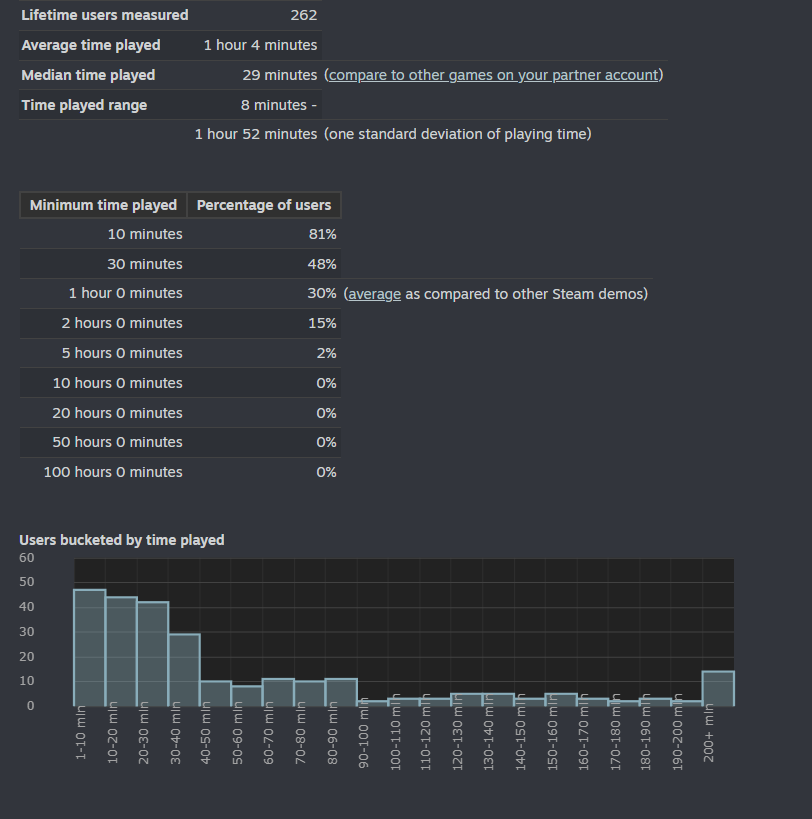
In this histogram, many of the players have played for over an hour. Longer playtimes generally correlate with higher conversion success because:
- Higher Engagement Signals Interest – If a player spends more time in a demo, it indicates they are engaged and enjoying the experience, making them more likely to wishlist the game for future purchase.
- Better Exposure to Game Features – Longer playtime allows players to experience more mechanics, story elements, or progression, increasing attachment and the likelihood of conversion.
- Increased Psychological Commitment – The “sunk cost fallacy” suggests the longer someone invests in an experience, the more likely they are to continue it (by purchasing the full game).
Let’s refine how this impacts our wishlist quality. We might say:
Medium Quality Wishlist (2) = Number of “Played And Wishlisted” if under 30% of players reach the one-hour mark.
High Quality Wishlist = Number of “Played And Wishlisted” if over 30% of players reach the one-hour mark.
Thinking Critically – How Would You Rate This Game?
Part of our goal with these articles is to have developers think critically about the information we provide and then apply it to their own games. Let’s look at an example.
We previously wrote an article on Marketable and Compelling games, differentiating between what is marketable and what is compelling. Normally, the wishlist count is higher than the demo play count because wishlisting is the easier action. But consider a situation where the total players exceed the total wishlists:
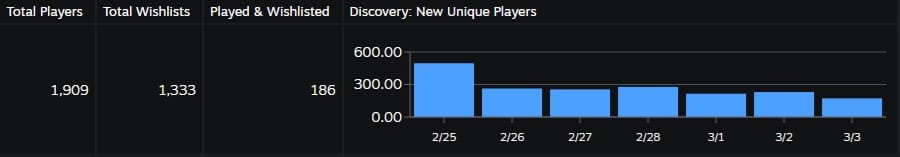
1,909 people played the game, but only 186 of them wishlisted it. It might seem good at first—lots of people tried the demo. However, that’s only a 9% wishlist rate. According to How To Market A Game, the average conversion rate of those who play a demo is around 20%. This is a red flag, so let’s dive into the average playtime in the chart:
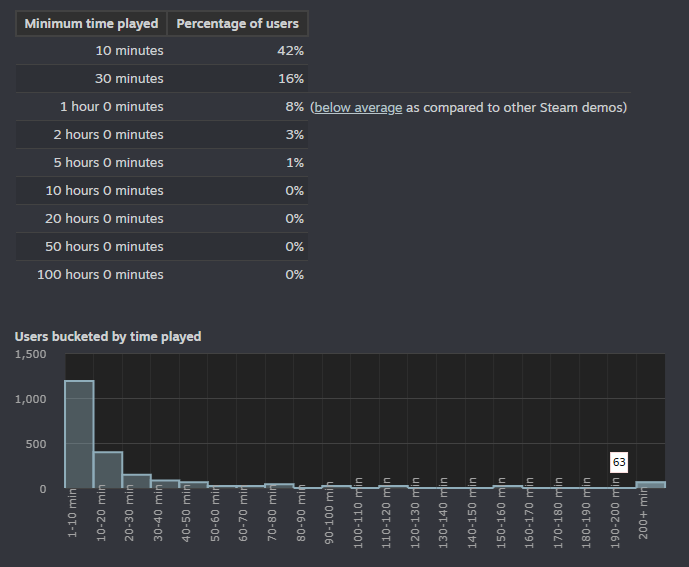
As you can see, the playtime for this game is quite low. Just based on these numbers, how would you rate this game in terms of:
- Marketability
- Whether people enjoy playing it
- The overall quality of the wishlists and likelihood of conversion
How This May Affect Your Game
Let’s bring this full circle and see how it may relate to your game and what kind of sales you can expect. As stated at the beginning, there isn’t enough data to fully prove this, so we are using abductive reasoning to propose some formulas. To understand the percentage of your wishlist:
Low Quality Wishlist = (Total Wishlists - External Source Visits To Wishlists - Played & Wishlisted) * 0.05
Medium Quality Wishlist = (External Source Visits To Wishlists - Played & Wishlisted) * 0.20
Medium Quality Wishlist (2) = (Number of “Played And Wishlisted” if under 30% of players reach the one-hour mark) * 0.20
High Quality Wishlist = (Number of “Played And Wishlisted” if over 30% of players reach the one-hour mark) * 0.40
Do these calculations and save the numbers for your reference. When you launch your game, feel free to send your statistics to stats@glitch.fun. We will aggregate and refine a formula that all games can use to assess their wishlist conversion to sales.
That’s it for this hypothetical breakdown of why high wishlist numbers from NextFest don’t always translate into strong sales. By analyzing the source of wishlists, the level of engagement (playtime), and overall conversion benchmarks, developers can more accurately gauge which wishlists are likely to convert—and focus on improving the user experience and marketing strategy accordingly.